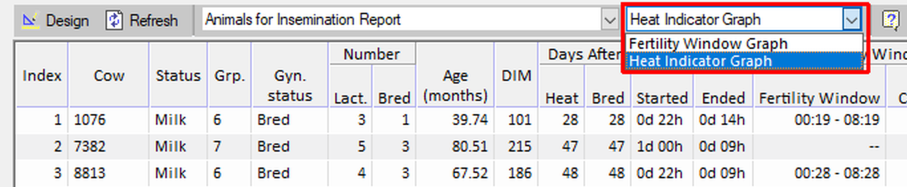
Heat Indicator Graph
Open the Heat Indicator Graph to identify heat trends/cycles, to determine when signs of heat are genuine or potentially caused by other events or activity.
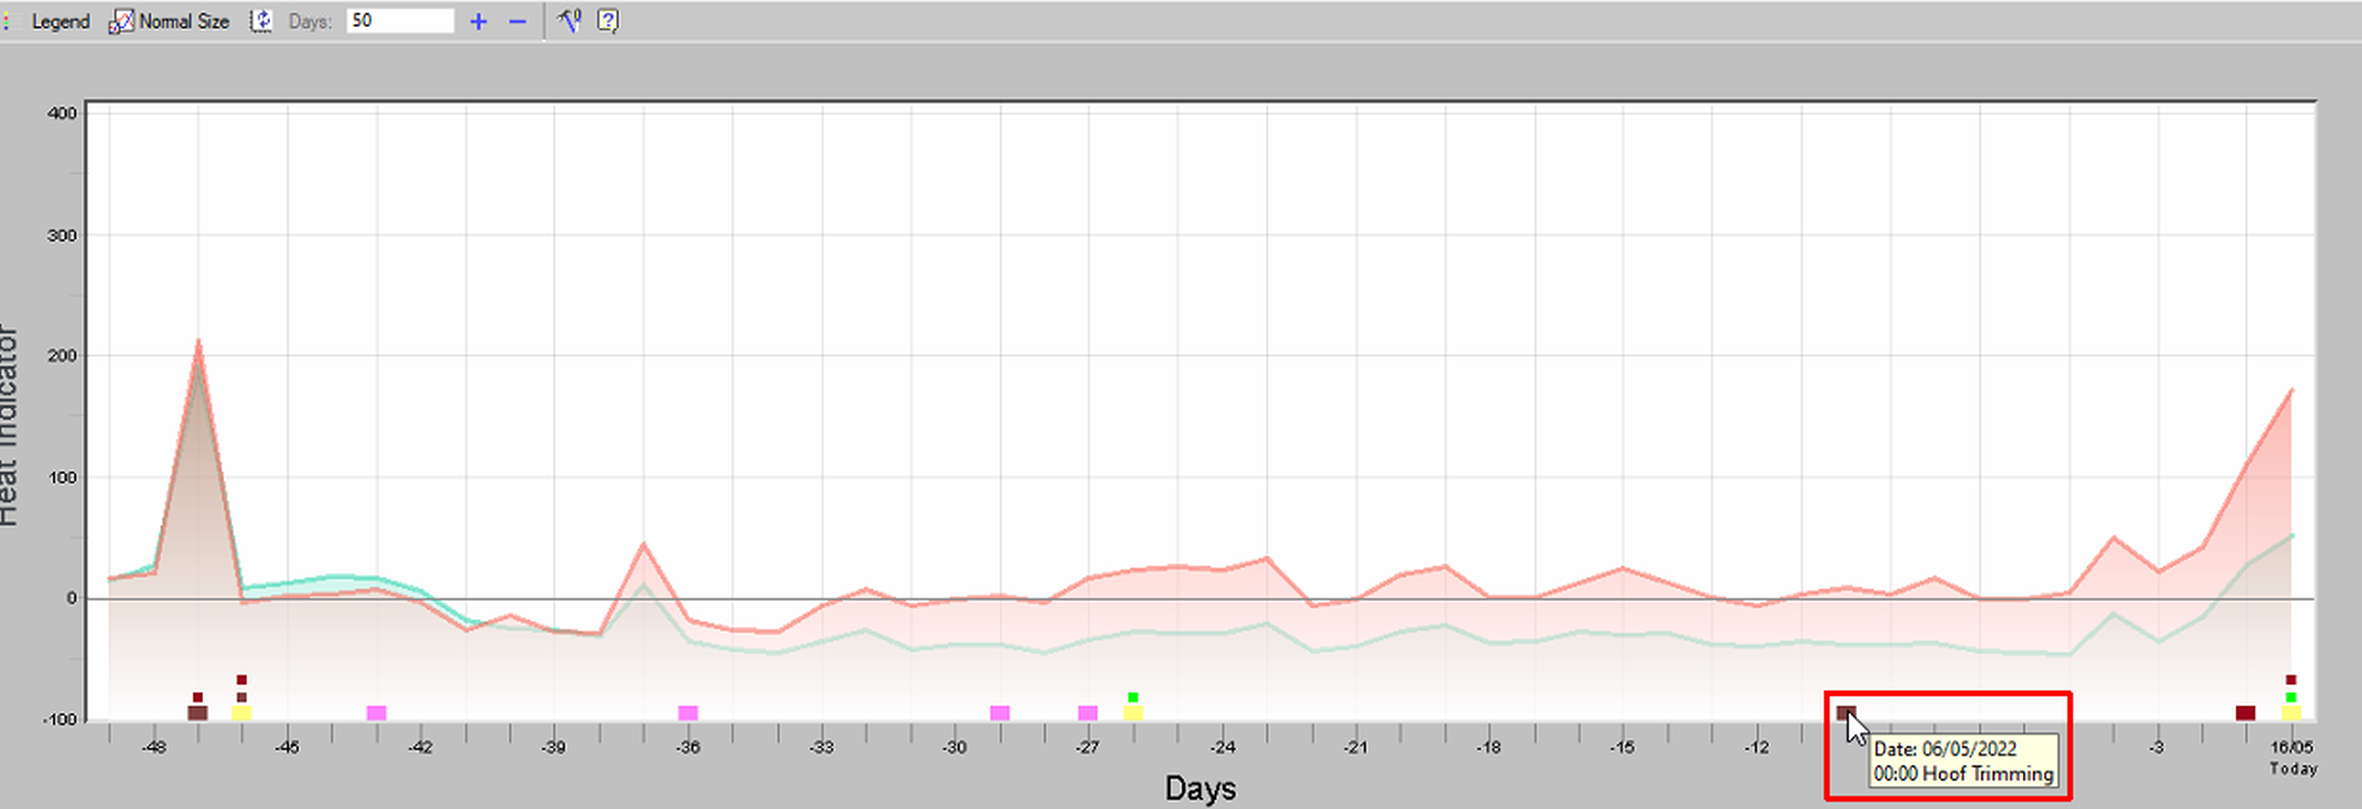
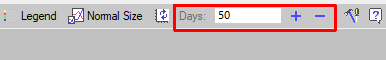
The graph's time span is set by default to the last 3 days; it can be extended to reflect the last 50 days. This is especially helpful when viewing trends and previous heat cycles.
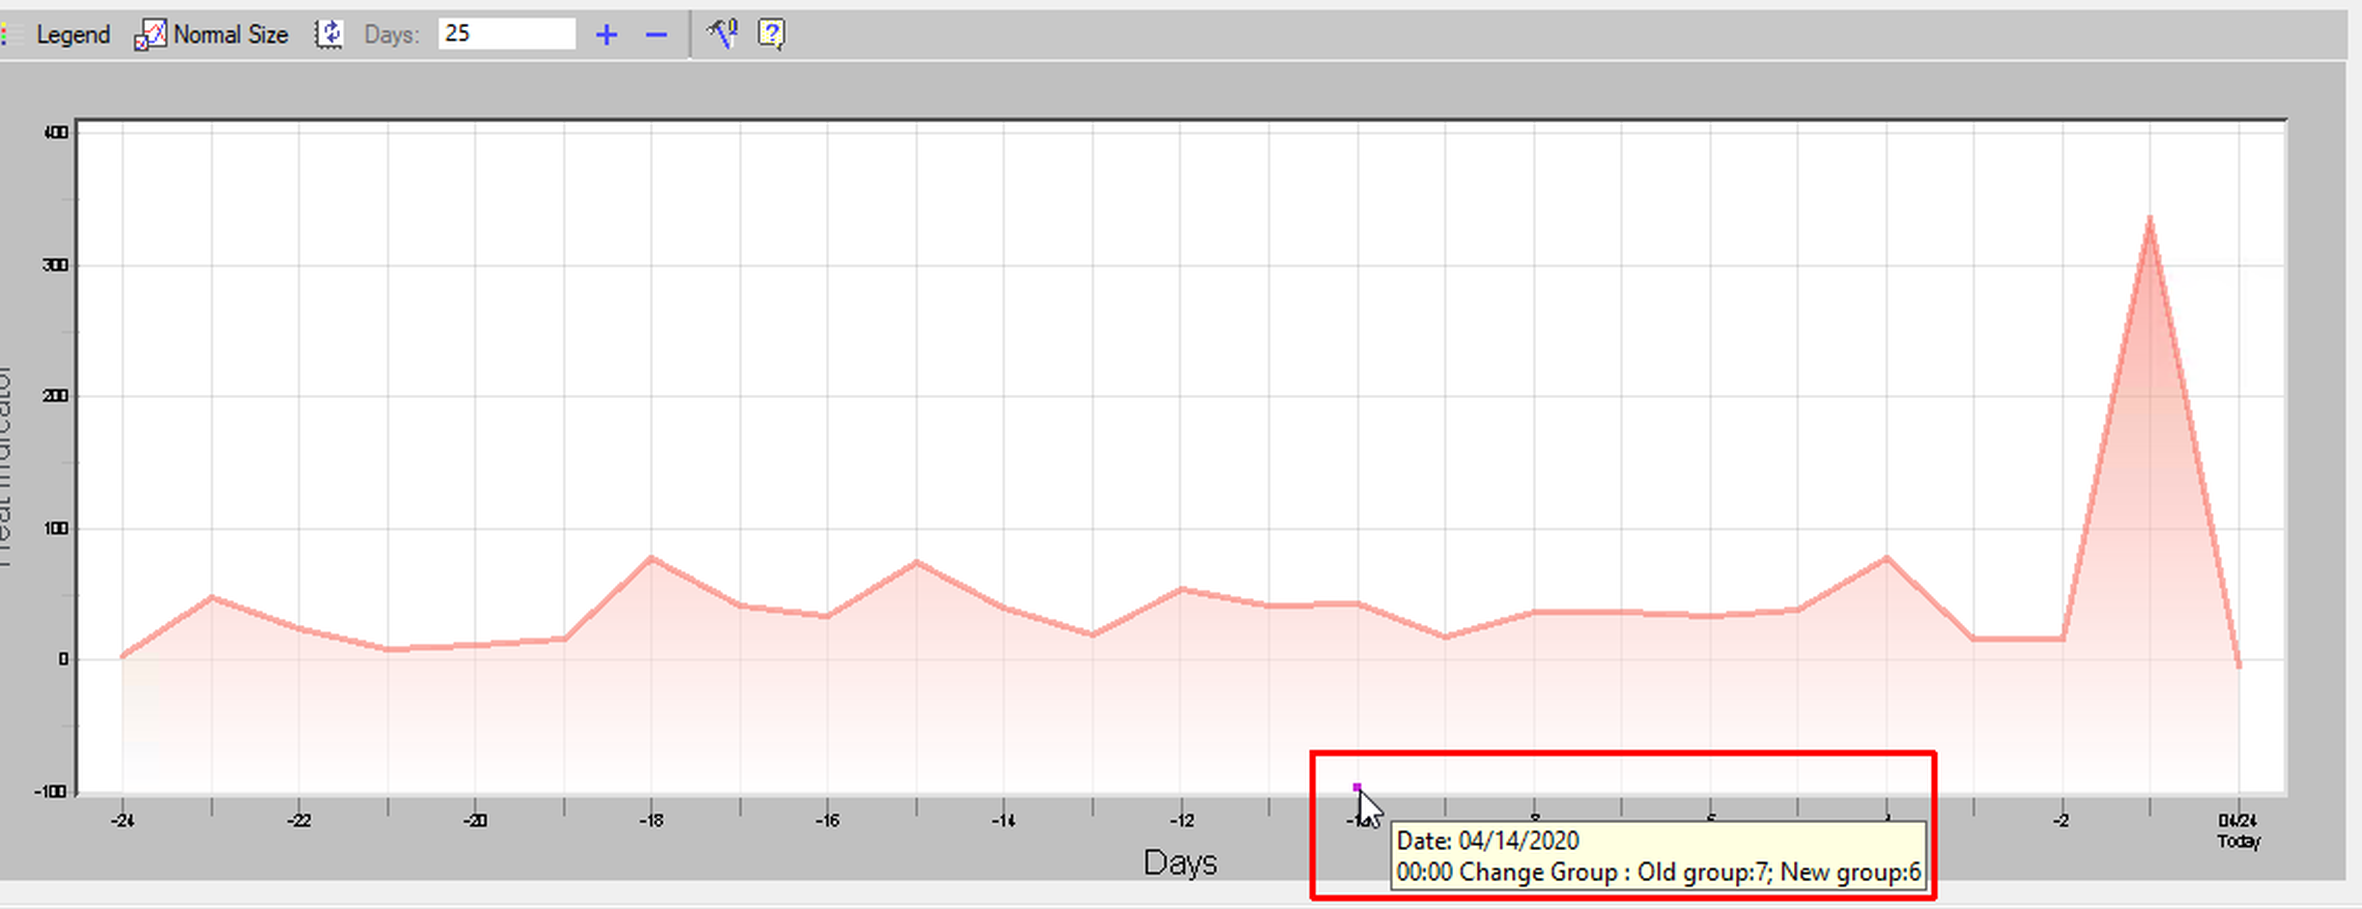
Events are displayed along the time line to help you determine if changes in the animal's behavior, which are used to determine a heat event, are actually a result of heat cycles, or a false alert caused by a recent event such as an pregnancy check, hoof trim, or group change. Hover on the event to display the event information, see Identify True Heat Events
Red legend = heat
Open the Heat Indicator Graph to identify heat trends/cycles, to determine when signs of heat are genuine or potentially caused by other events or activity.
The graph's time span is set by default to the last 3 days; it can be extended to reflect the last 50 days. This is especially helpful when viewing trends and previous heat cycles.
Events are displayed along the time line to help you determine if changes in the animal's behavior, which are used to determine a heat event, are actually a result of heat cycles, or a false alert caused by a recent event such as an pregnancy check, hoof trim, or group change. Hover on the event to display the event information, see Identify True Heat Events
Red legend = heat
Green legend = activity