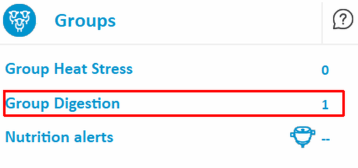
Group Digestion Report
Eating and rumination are critical aspects of a dairy cow's life. Any deficit of this activity directly, or indirectly, indicates that a problem has occurred. Significant eating or rumination changes within an entire group is indicative of a feed or feeding issue or environmental changes that has impacted the group's feed intake, including:
-
Late distribution of feed,
-
Change in the size or composition of feed,
-
Feed is out of reach,
-
Defective/moldy feed.
AfiFarm uses eating and rumination times of a group to indicate that such a deficit has occurred. These are reported in the Group Digestion report, which provides alerts to groups that may have a feeding problem.
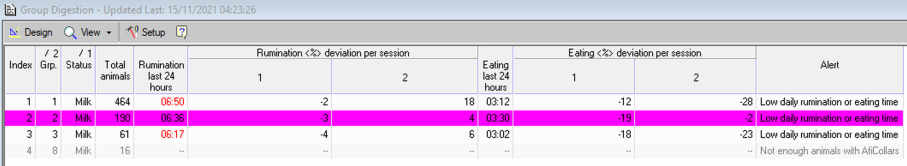
Each line in the report represents a group and its rumination and eating times.
Every substantial deficit at the group level is displayed in red. Use the report as a prompt to investigate what alterations to the group's nutritional regime may have caused the rumination or eating changes.
Understand the report
The Group Digestion Report provides the following data for the last 24 hours:
Note: Values displayed in red indicate groups whose average eating and/or rumination behavior has exceeded set thresholds.
|
Data |
Description |
|---|---|
|
Rumination/Eating last 24 hours |
Displays total average rumination and eating times (HH:MM) for the group, for the last finished daily sessions. |
|
Rumination/Eating % deviation per session |
Displays the rumination/eating percentage deviation for the group, for each specific session. |
|
Alert |
Displays the type of deviation detected, as one of the following:
|
Click a row in the top pane of the Group Digestion report to open the group's Detailed Report/Graph view below.
Graph View
The Graph View displays the daily eating and rumination times of the group over a set period (default = last 30 days).
The example below shows a drop in the group's average daily rumination and eating times in the last 3 days.
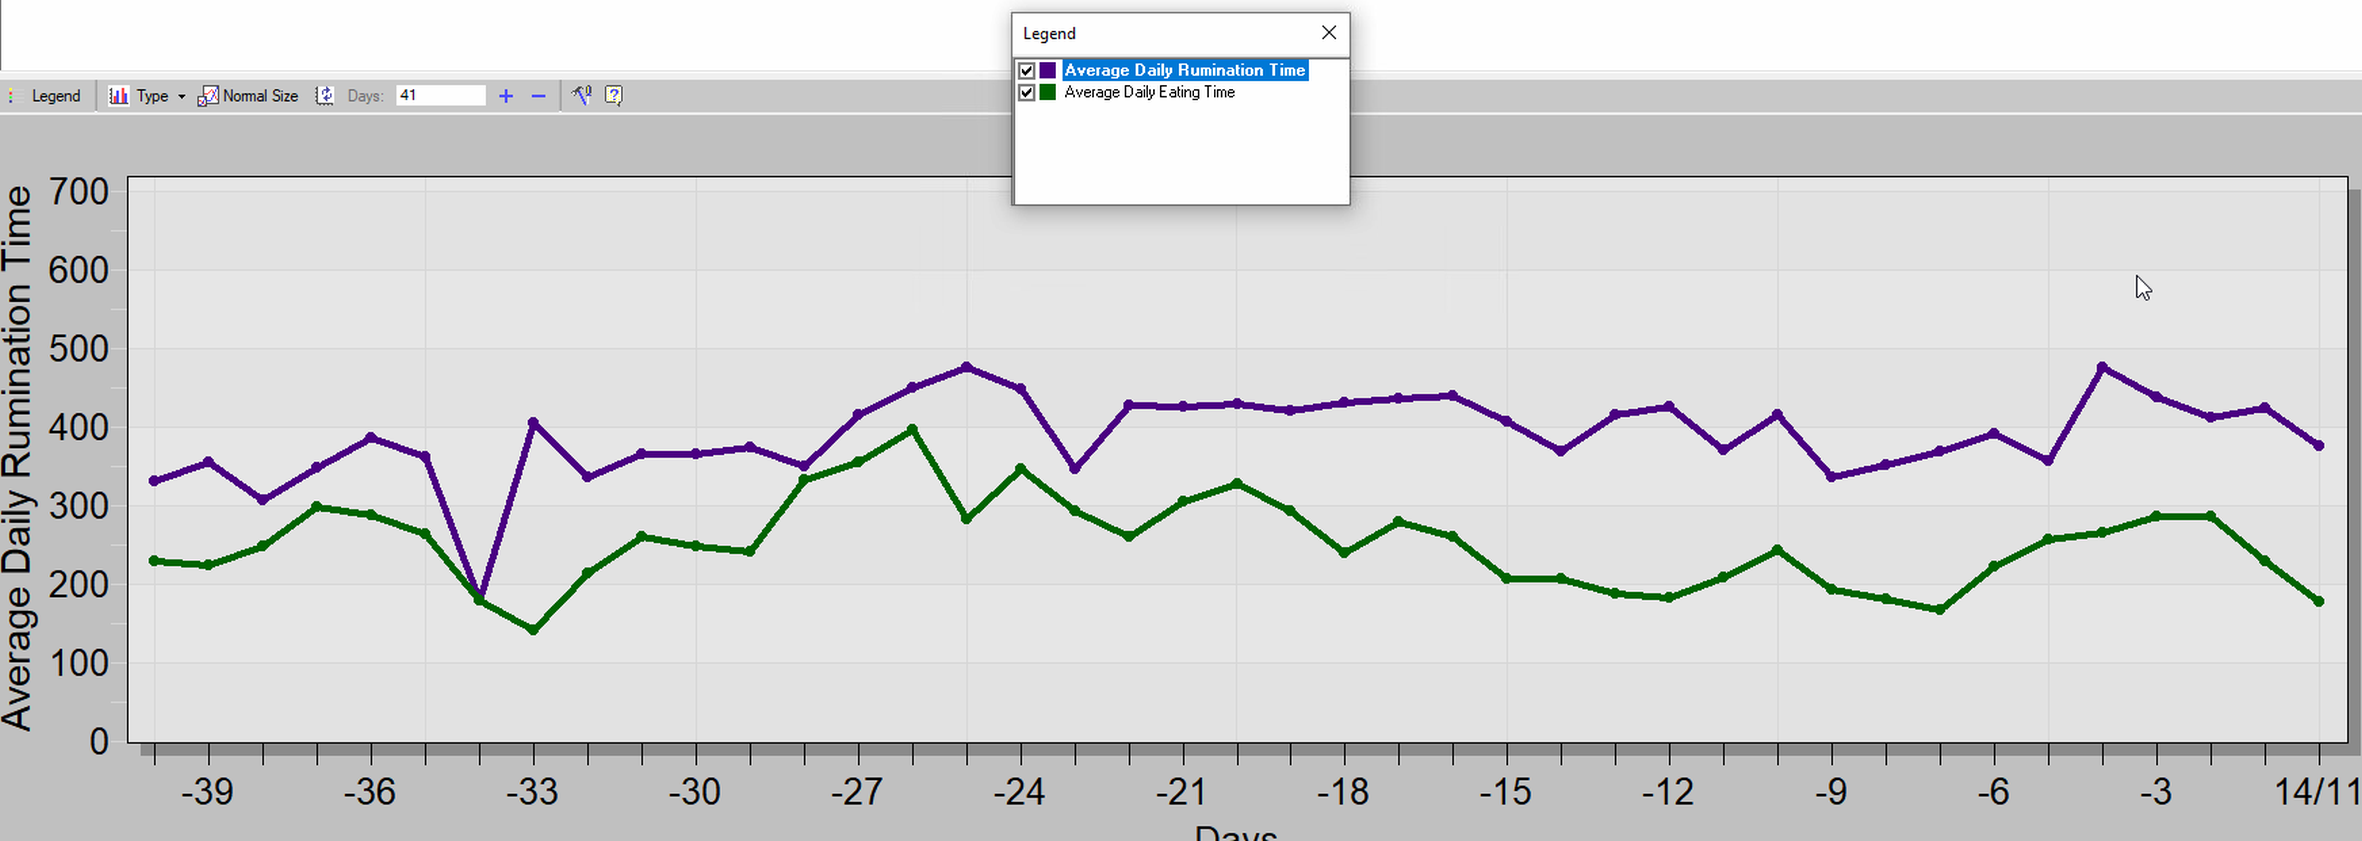
The Graph view displays the rumination and eating times for the selected group as follows:
-
Green legend – indicates the average daily eating time for the group.
-
Purple legend – indicates the average daily rumination time for the group.
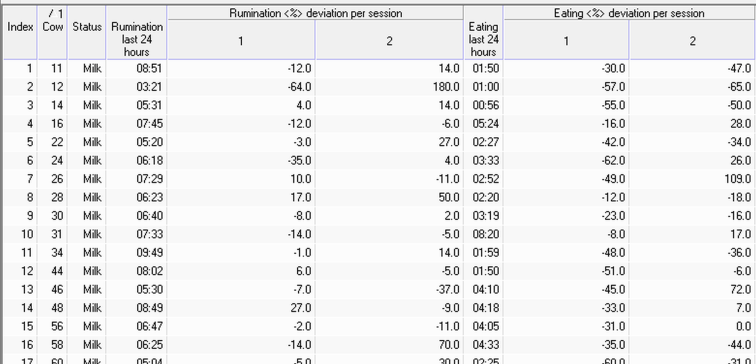
Detailed Report View
The Detailed Report view displays the rumination or eating deviation data for each cow in the group.
The Group Digestion report is only available for farms with the AfiCollar configuration.