Verify Causes of Nutritional Imbalances
Hinweis: Diese Seite ist nicht ins Deutsche übersetzt; sie bezieht sich auf Afimilk-Melkstand-Geräte.
By understanding which components of the group's milk yield is affected by the nutrition imbalance, it is possible to determine the reasons for the problem, and solutions to correct the issue.
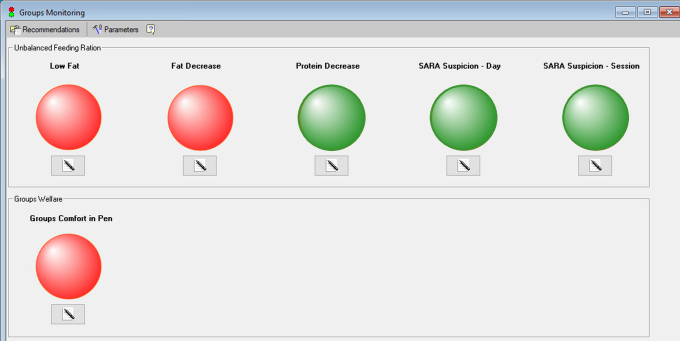
The Groups Monitoring screen provides clear alerts to the milk components that have deteriorated. Use this information to take steps to quickly correct the causes.
See more details about how to access the Group Monitoring screen.
-
Green indicators – nutritional values are within optimal limits.
-
Red indicators – nutritional values are not within optimal limits.
|
Data |
Possible Causes: |
Guidelines for Action: |
|---|---|---|
|
Low Fat
|
Red - Indicates low daily fat percentage values. |
|
|
Possible Causes:
|
Guidelines for Action:
|
|
|
Fat Decrease
|
Red - Indicates a decrease in milk fat percentage. |
|
|
Possible Causes:
|
Guidelines for Action:
|
|
|
Protein Decrease
|
Red - Indicates a low protein trend. |
|
|
Possible Causes:
|
Guidelines for Action:
|
|
|
SARA Suspicion – Day
|
Red - Indicates signs of Sub-Acute Ruminal Acidosis (SARA) in the last 24-hours, in one or more groups in the herd, with one or both of the following parameters exceeding the acceptable range:
|
|
|
Possible Causes:
|
Guidelines for Action:
|
|
|
SARA Suspicion – Session
|
Red – Indicates signs of SARA in one or more milking sessions, in one or more groups in the herd. |
|
|
Possible causes:
|
Guidelines for action:
|
|

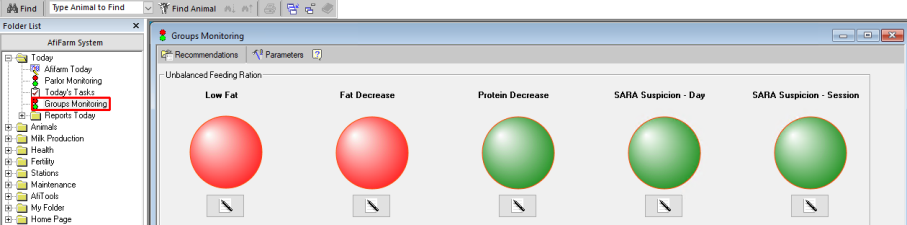
Access the Group Monitoring screen
The Group Monitoring screen is accessed via the Folder list in the Dashboard.
To view the Groups Nutrition Monitoring screen:
-
Open the Folder List.

-
Expand the Today folder, then click Groups Monitoring.