AfiLab Hygiene
Hinweis: Diese Seite ist nicht ins Deutsche übersetzt; sie bezieht sich auf Afimilk-Melkstand-Geräte.
AfiLab requires routine, thorough cleaning similarly to the other equipment in the parlor to ensure accurate data and timely alerts to problems. Lactose measurements deteriorate when the system is not washed properly. This may be used to detect wash problems.
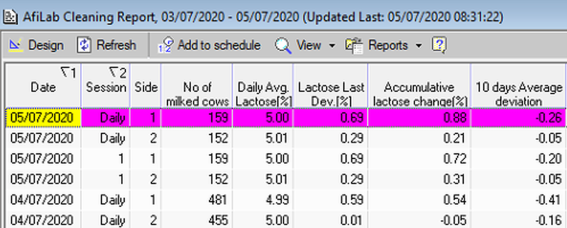
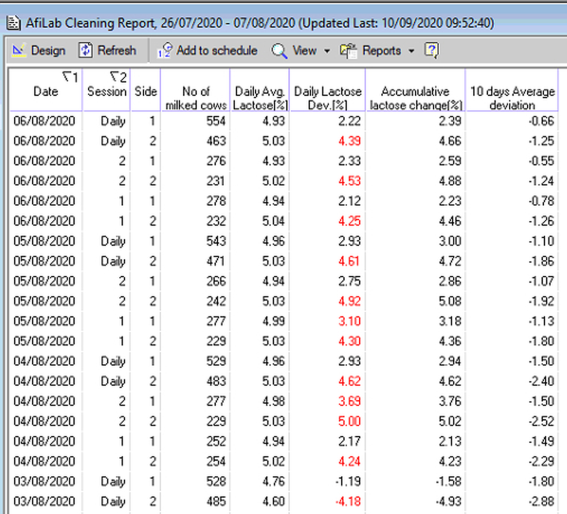
The AfiLab Cleaning Report details the average daily lactose % and deviations from this over a one-day and 10-day period. Deviations that exceed acceptable thresholds appear in red.
To view the AfiLab Cleaning Report:
-
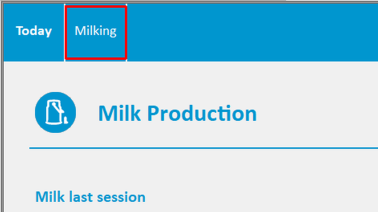
On the ABC Dashboard, click the Milking tab.
-
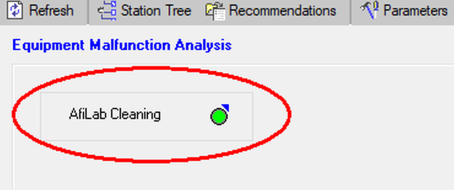
On the upper left-hand side of the Milking Efficiency dashboard view the AfiLab cleaning indicator:
-
Green – No cleaning problem was detected.
-
Red – AfiLab is not clean. Check your CIP system.
-
Yellow – Lack of data.
-
Click the
 to open the AfiLab Cleaning Report.
Example 1: No Wash Problems
The Daily Avg. Lactose % column can provide an immediate indication of wash problems. The Daily Average lactose % should consistently sit at 5.00, with only slight deviations.
In the example at right, the Daily Avg. Lactose is stable, and only slightly deviates around the 5.00%.
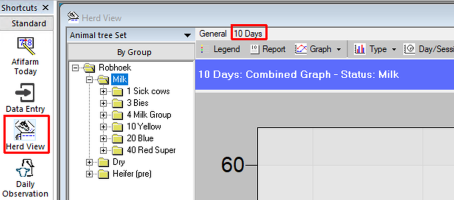
Open the 10 Days Graph for a visual profile of lactose % over the last 10 days.
To open the 10 days herd view graph:
-
In the Shortcuts pane, click Herd View.
-
In the Herd View window, click 10 Days.
-
Click Legend, then in the Legend dialog box, make sure on only the Lactose check box is selected.
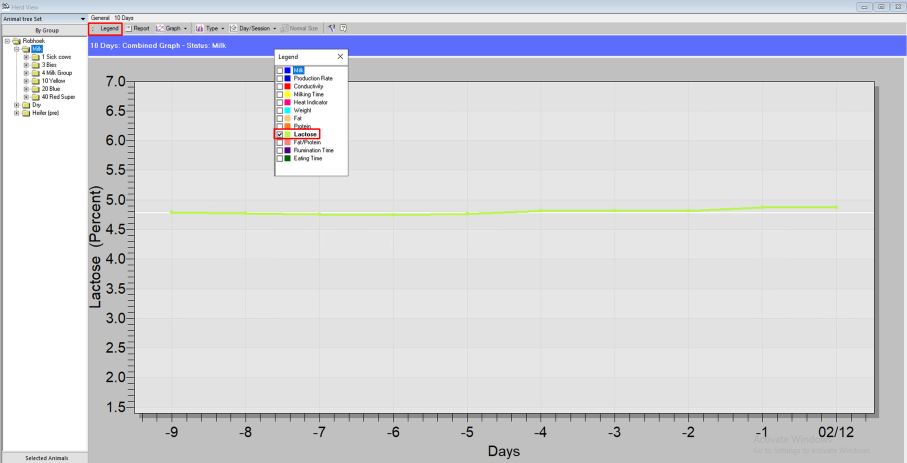
Note: In the 10 Days graph, when there are no wash problems, the green Lactose legend runs in a stable line along the white average legend, as shown in the image.
Example 2: Daily Lactose Measurements Deteriorate
A wash problem is detected when the Daily Average Lactose % is not stable between days, sessions, or even sides of the parlor. When the lactose % deteriorates, the values in the Daily Lactose Deviation % column exceed their thresholds, and these values are displayed in red. This alerts users to a wash problem, such as insufficient water temperature or detergent.
The wash problem can also be viewed through the Milk Component vs AfiLab graph.
To access the Milk Component vs AfiLab graph:
-
In the Folder List, expand Milk Product, and then click Milk Production Reports.
-
In the Report List window, double-click Milk Component (m.t.) Graph vs. AfiLab.
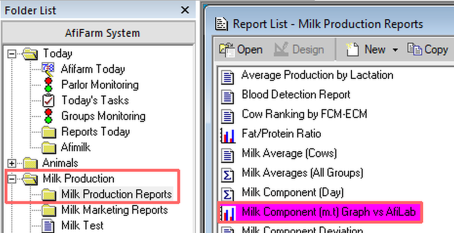
The graph opens.
-
Select only the Lactose legend.
-
Zoom into the relevant area of the graph by highlighting it.
In the example, it is possible to see when the lactose drop occurred. This drop caused the Daily Lactose Deviation % to appear red in the Cleaning Report.
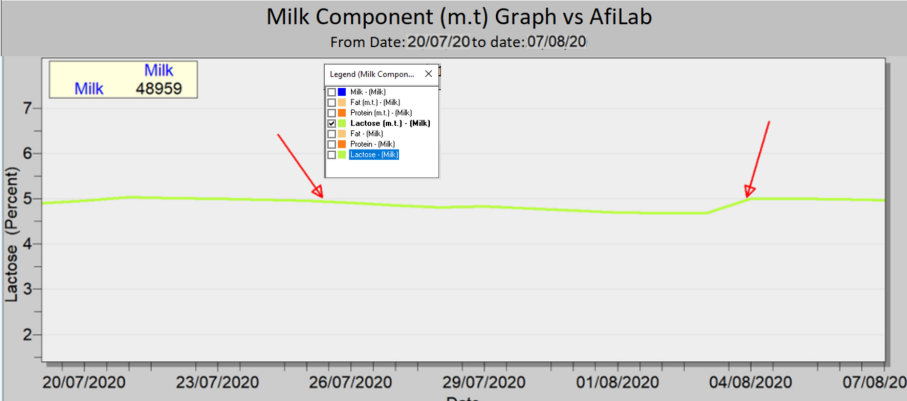
Note: Once the problem is corrected, the Lactose legend stabilizes.
However, in the Cleaning report, when a major change in lactose measurement occurs (may be due to a calibration after a cleaning problem) the system may continue to alert to deviations for some time (up to 2 weeks after correction). If alerts continue after this time, please contact support.